 In the introspector perspective you can observe and manipulate
the internal state of agents.
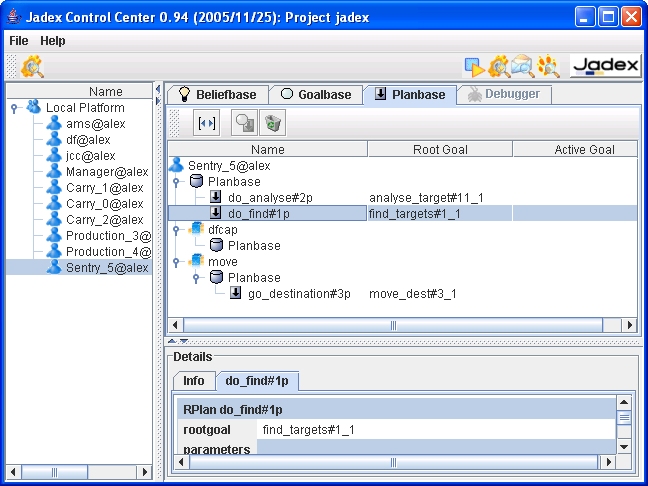
In Figure 4.1, “Introspector overview” the introspector
is shown while observing an agent from the marsworld example.
You can use the agent tree at the left side to select agents you want to observe.
The observation view for the selected agent is shown
on the right side. In the observation views four different panels can be seen
and chosen.
The Beliefbase, Goalbase and
Planbase tabs show the contents of the belief, goal
and plan base, respectively. Alle these panels are described in
Section 4.1, “Base Panels”. The
Debugger tab allows to observe and control the event processing,
consisting of plan selection and execution in the
debugger panel.
In the introspector perspective you can observe and manipulate
the internal state of agents.
In Figure 4.1, “Introspector overview” the introspector
is shown while observing an agent from the marsworld example.
You can use the agent tree at the left side to select agents you want to observe.
The observation view for the selected agent is shown
on the right side. In the observation views four different panels can be seen
and chosen.
The Beliefbase, Goalbase and
Planbase tabs show the contents of the belief, goal
and plan base, respectively. Alle these panels are described in
Section 4.1, “Base Panels”. The
Debugger tab allows to observe and control the event processing,
consisting of plan selection and execution in the
debugger panel.
Below the tabs in the observation window, a details panel shows details of elements (e.g. beliefs or events) selected with double click. This details panel is shared by all activated tabs, and therefore shows the last elements selected in any tab.
Three base panels show the beliefs ( ), goals (
 ), and plans (
 ) respectively.
They are very similar in their usage (see
Figure 4.2, “The Beliefs Panel of Introspector”).
All elements are shown in a tree structure
representing the containment hierarchy of the elements
in the capabilities of the agent.
) respectively.
They are very similar in their usage (see
Figure 4.2, “The Beliefs Panel of Introspector”).
All elements are shown in a tree structure
representing the containment hierarchy of the elements
in the capabilities of the agent.
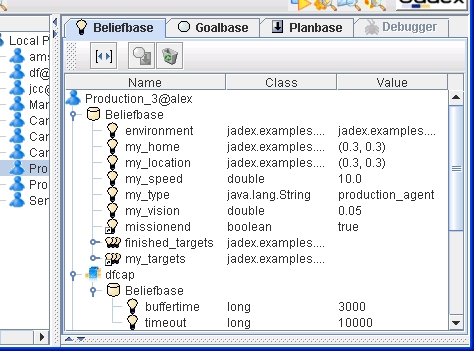
The different elements of the agent are shown with different icons as explained in Table 4.1, “Introspector Base Panel Elements”. For each element the most important attributes are displayed directly in the tree/table structure. The content of the base panels will automatically be updated when changes occur inside the agent.
Table 4.1. Introspector Base Panel Elements
| Element | Description |
|---|---|
|
|
The agent containing all other elements |
|
|
The capability with its contained elements |
|
|
The beliefbase containing all beliefs of a capability |
|
|
A single fact belief, or fact contained in a belief set |
|
|
A belief set containing a number of facts |
|
|
A belief visible in this capability, but declared elsewhere |
|
|
A belief set visible in this capability, but declared elsewhere |
|
|
The plan base containing all plans of a capability |
|
|
A currently running plan |
|
|
The goalbase containing all goals of a capability |
|
|
An adopted goal (active or inactive) |
|
|
A goal currently being processed by some plan |


The tree component allows nodes to be closed to focus on interesting subsets of the agent's functionality. The column widths can be (auto-) adjusted by dragging or double-clicking between the column headers. The table headers also provide a popup->menu (opened with right-click) that allows to hide some of the columns for better readability. You can double click on the elements to see more detailed information. The details panel is not automatically updated, you may have to double click the element again, to see up to date information.
You can to some extent manipulate the elements shown in the base panels. E.g. you can alter the values of facts in the beliefbase. Double click on the fact value you wish to change (in the value column), and then enter the new value as Java expression (i.e "text" for a string value). The expressions are evaluated using the imports as specified in the ADF (of the corresponding capability) therefore you can write expressions just as you would do that in a <fact> tag of the ADF. In addition, popup menus are available e.g. to remove beliefs, terminate plans or change the state of goals.
Some options are available to influence the appearance of the base panels (see Table 4.2, “Introspector Base Panel Options”). It is possible to deactivate (and later resume) the observation of any tab independently, by right-clicking on the tab's title. The observed agent will continue to execute, but changes will not be reflected in the panel until the observation is resumed. To pause the execution of the observed agent use the debugger panel described in the next section.
Table 4.2. Introspector Base Panel Options
|
|
Resize all columns to fit to length of contained entries |
|
|
Show / hide removed elements (e.g. finished plans) |
|
|
Flush removed elements from memory |
|
|
Toggle goalview / planview (only for goalbase tab) |


The resize icon allows to auto-adjust the widths of the table columns to fit the displayed content. The next two icons are concerned with the presentation of removed elements. Because the final state of a goal or a plan may be of interest after the goal has been dropped or the plan has terminated, the panels have an option not to remove those elements from the representation, but just visually mark them as removed. This is especially useful for debugging your agents, e.g. in conjunction with the debugger view described in the next section. To flush removed beliefs, goals and plans from the representation, you can use the waste bin icon.
The last icon is only available in the goalbase panel.
It allows to switch between the goalview and the planview representation
of the agent's current goals.
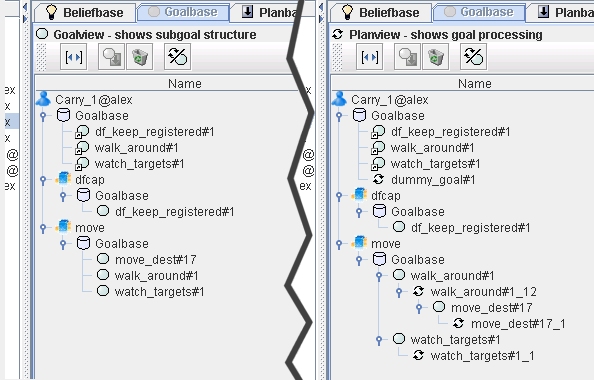
The goalview, shown by default, displays only the proprietary goals
(not the process goals created for each executed plan).
The goals are arranged in the goal/subgoal hierarchy,
i.e. a subgoal of a plan is shown as a subnode of the goal for which the plan is executed.
Although this shows the goal hierarchy as expected,
this is not how it is actually constructed inside the agent.
The goalview hides that for each plan execution a process goal is created
as a copy of the original goal.
Subgoals dispatched by plans are actually created
as subgoals of the process goal and not of the proprietary goal.
For plans that are executed in reaction to internal or message events
a dummy goal is created, which is also hidden in the goalview.
Both views are compared in Figure 4.3, “Goalview and planview”.
In the planview you can see that the move_dest#17 goal was actually created
by a plan as a subgoal of the walk_around#1_12 process goal.
 The debugger panel allows watching the event
processing inside an agent. The window is made up of the agenda area,
the agenda control area in the middle and the details view at bottom (see
Figure 4.4, “The Beliefs Panel of Introspector”.
The debugger panel allows watching the event
processing inside an agent. The window is made up of the agenda area,
the agenda control area in the middle and the details view at bottom (see
Figure 4.4, “The Beliefs Panel of Introspector”.
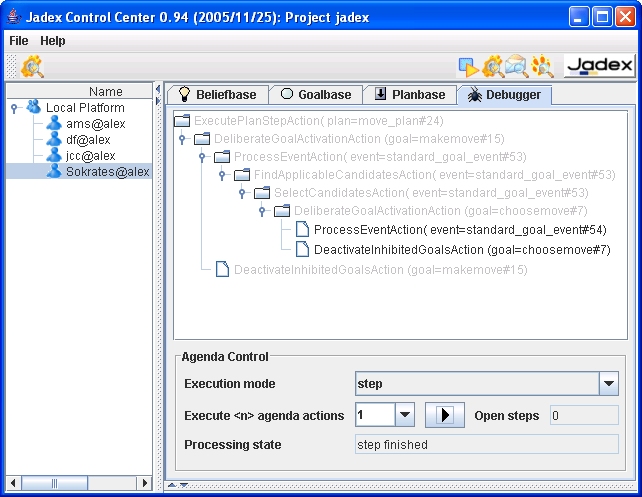
The agenda contains all current action entries of the agent, whereby entries in light-grey denote already processed actions. In addition it can be seen whether entries currently have a valid precondition and thus can subsequently be executed; otherwise they are marked as (invalid). Such invalid actions will not be executed, but just ignored by the execution mechanism. To see some more information about an agenda action you can click on it and inspect its values in the details view. In addition to observing the agent's internal behaviour the tool also allows you to control the agenda execution by performing actions in step mode. If the execution mode is set to step or cycle you can use the forward button to execute as many steps as shown in the execute <n> agenda actions choice. The difference between step and cycle mode concerns only the execution of ProcessEventActions that are decomposed to finer-grained sub steps (FindApplicableCandidatesAction, SelectCandidatesAction and ScheduleCandidatesAction) when the step mode is activated. Therefore, the step mode allows you to examine the details of the BDI plan selection process what can be helpful in understanding and explaining unexpected application behaviour. The open steps status bar shows the progress of the action execution by highlighting the number of steps the agent still has to perform whereas in the the processing state line it can be seen if a step is currently requested or has been finished.