The BDI Tracer is accessible from the Jadex Control Center tool
bar. It is a tool inspired by
the Ph.D. work of Dung N. Lam
working on agent software comprehension with abductive
reasoning.
The tracer provides basically an interface and means to log the
internal state of a BDI agent, and to analyze and visualize the
logged information. It is made of two components. The first one
is the TracerAdapter placed in front of an agent as a tool
adapter. It is responsible for filtering messages concerning the
tracing process away from the message queue of an agent and it
collects the information about agent's internal state changes
and other occurrences in the system. The information is then
sent to the Tracer Agent, if an instance is present on the
platform. The latter has the duty to analyze the traces, store
them, and to present them to the user in a graphical form.
The main window of the tracer agent may be seen in Figure 7.1, “Tracer Main Window”.
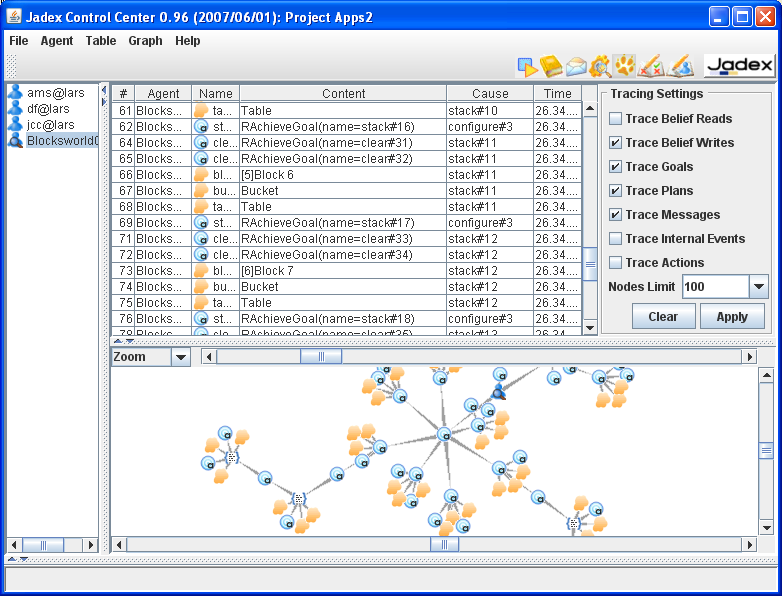
The traces presented above are from the Blocksworld example. In order to indicate a type of traces, they are marked with icons and their different meaning is explained in Table 7.1, “Information logged by the tracer”:
Table 7.1. Information logged by the tracer
|
|
Actions describe internal processes (i.e. internal agenda meta actions) of an agent and are by default ignored by the tracer. |
|
|
Beliefs are meta traces that collect all traces concerning the use of beliefs and their change. Belief read and write access indicate that an agent or one of its plans have accessed a belief and possibly changed it. |
|
|
The icons stand for message reception or send events respectively. |
|
|
Goals are traced when they are adopted by the agent. The icons on the left side represent different goals: achieve goal, perform goal, query goal, maintain goal, meta goal. |
|
|
Plans are shown, when created in response to a goal or event. |
|
|
Internal events are traced whenever they are dispatched within the agent. |


The tracer perspective is split into four views including a tree view of agents and traces, a tabular view of traces, tracing settings and a 2D trace space exploring panel.
At the left there is a tree view showing all agents known to the tracer. The meaning of a particular icon depicting an agent is shown in Table 7.2, “State of an agent”. Descending from the BDI agents, all traces are linked beneath nodes identified to be their cause.
Table 7.2. State of an agent
|
|
The agent is ignored by the tracer. |
|
|
The agent sends its traces to the tracer. |
|
|
The agent has died. |


The functionality provided by the tree popup menu is similar to the functionality from the menu (Section 7.2.1, “Agent Menu”) and concerns the currently selected trace or agent. In the case of an agent the user may choose to observe it and to adjust the trace filter and history limit (). The other options allow to show or hide traces in the graph or table. With the last menu item the trace or the agent may be removed from the tracer perspective.
On the right side there are three views. The upper one in the middle shows a tabular view of the traces, as can be seen in Figure 7.3, “Trace Table”:
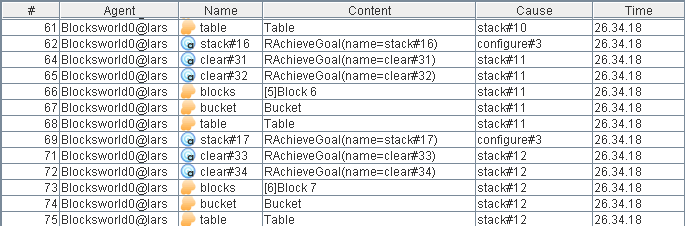
The traces are ordered in the sequence they arrive. The table shows information like a unique trace id, the agent name, the event name, The event name and the content are closely related and explain which kind of event occurrence has happened. The cause describes the reason for the event occurrence and the time shows when the event has happened.
The user may select traces in the table based on different criteria, remove them from the table, show them in the graph panel or delete from the tracer perspective. All the fuctionality is accessible under the (Section 7.2.2, “Table Menu and Tracing Settings”) and a corresponding popup menu.
The view on the upper right side, offers some tracing settings, as can be seen in Figure 7.4, “Tracing Settings”:
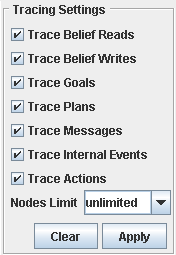
Check boxes let the user specify what to trace and above the number of traces to show can be chosen from a pull down menu. The changes can be applied by the button “apply” and the other button labled with “clear” clears the trace table.
The lower one of the three right views is the graph panel allowing to explore the space of traces. It also provides multiple presentation options e.g. for selection of and correletion and between the traces. All this functionality may be accessed from the "Graph" and the graph popup menu. (see Section 7.2.3, “Graph Menu”).
The menu provides access to functions concerning the tracer agent itself and the BDI agents analyzed. Functions corresponding to the tabular view and the 2D graph view are also accessible from here.
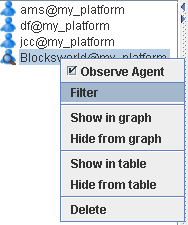
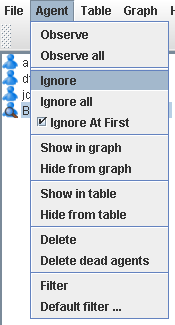
Under this menu (cf. Figure 7.5, “Agent Menu” concerning agents the user has the option to:
- an agent. This will tell the agent to send its traces to the tracer.
- will cause all BDI agents (known to the tracer) to send their data.
- an agent. Has the complementary effect to Observe.
- is the reverse of Observe all.
- causes the tracer to ignore all newly occurring agents.
- tells the tracer to show the traces of an agent in the 2D graph as soon as they arrive.
- removes all agent traces from the 2D graph.
- tells the tracer to show the traces of an agent in the table.
- removes all agent traces from the table.
- removes the agent and corresponding traces from all views.
- removes all dead agents and their traces from all views.
- shows a filter dialog for the current selected agent.
- shows a filter dialog for a prototypical agent all new agents will inherit their properties from.
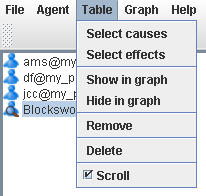
The menu (cf. Figure 7.6, “Table Menu” ) provides functionality concerning the table view. Following options are available to the user:
- selects immediate causes of selected traces.
- selects the immediate effects.
- shows all selected traces in the 2D graph.
- hides selected traces from the 2D graph.
- removes traces from the table.
- deletes the traces and removes them from all views.
- tells if the table should be scrolled, when new traces arrive.
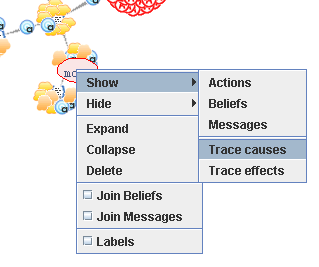
The tracer graph menu is accessible from the main menu and as popup in the graph view (cf. Figure 7.7, “Graph Popup Menu” ). It provides access to following functions:
- is used to show actions, beliefs or messages connected to trace nodes already shown in the graph. If a trace is selected, the user may choose to show the causes and effects of that trace.
- hides actions, beliefs or messages from the graph view. A single trace, its causes or its effects may be removed from the view.
- will expand the trace by one level of the causes or effects.
- will shrink and hide the traces around the selected one.
- will remove the trace from all views in the tracer.
- may be used to collapse all belief access nodes into a single one.
- will join the send and receive events of a message with an edge, therefore establishing connections between agents.
- this check-box indicates that the traces in the graph should be shown with thier corresponding labels instead of an anonymous icon. The labels are truncated by length and a selected trace is always shown with its label.